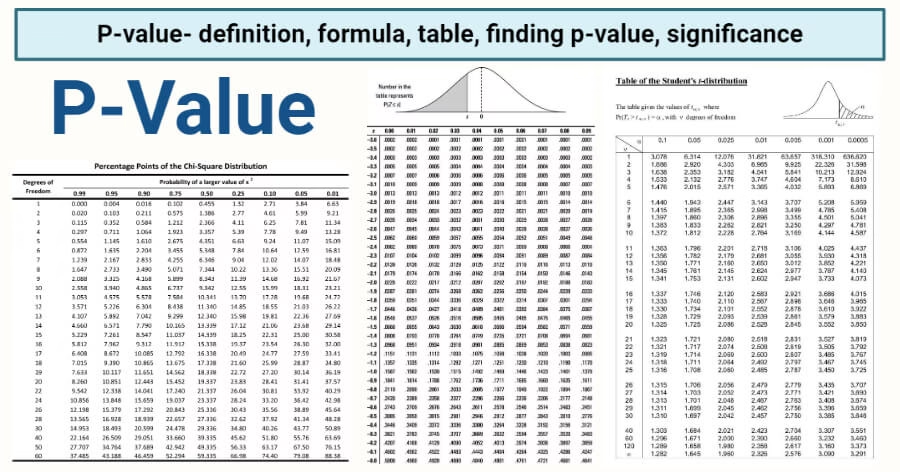
In research methodology and statistics, one of the most fundamental concepts used to interpret results from hypothesis testing is the P-value. Whether you are performing a t-test, z-test, chi-square test, ANOVA, or any other statistical test, the P-value helps researchers decide whether their results are statistically significant.
Researchers across fields- biology, medicine, psychology, environmental studies, agriculture, and social sciences- regularly rely on the P-value to determine if their findings are reliable or just due to random chance.
This article explains the P-value in simple language with detailed points, formulas, examples, and interpretation rules.
1. What is a P-value?
- The P-value (probability value) is a number between 0 and 1 that shows how likely the observed results are if the null hypothesis (H₀) is true.
- It tells us the strength of evidence against the null hypothesis.
- A small P-value means the observed results are unlikely to occur under the null hypothesis.
- A large P-value means the observed results are compatible with the null hypothesis.
Simple Meaning:
A P-value answers the question:
“If the null hypothesis is true, how likely is it to get results like the ones observed in the sample?”
2. Purpose of the P-value in Research
- Helps determine statistical significance of results.
- Offers a universal way of reporting results, independent of the test used.
- Allows comparisons across different experiments and fields.
- Provides evidence to either reject or fail to reject the null hypothesis.
Researchers often use the P-value to make evidence-based decisions.
3. Understanding the Null Hypothesis (H₀) and Alternative Hypothesis (H₁)
Before calculating a P-value, we form two hypotheses:
Null Hypothesis (H₀):
There is no effect, no difference, or no relationship.
Alternative Hypothesis (H₁):
There is an effect, a difference, or a relationship.
The P-value helps decide which hypothesis the data supports.
4. How is the P-value Calculated?
The P-value is not directly calculated by hand.
Instead, we calculate a test statistic such as:
- t-score (from t-test)
- z-score (from z-test)
- χ² value (from chi-square test)
- F-value (from ANOVA)
Then the P-value is obtained from:
- statistical tables (t-table, z-table, chi-square table),
- or software (Excel, SPSS, R, Python),
- or online calculators.
5. P-value Calculation Basics
Step 1: Perform the statistical test → get the test statistic.
Step 2: Determine degrees of freedom (for t-test or chi-square test).
Step 3: Enter the test statistic into the appropriate table.
Step 4: Read the probability value corresponding to the score.
Step 5: For two-tailed tests, multiply the probability by 2.
6. P-value from Different Tests
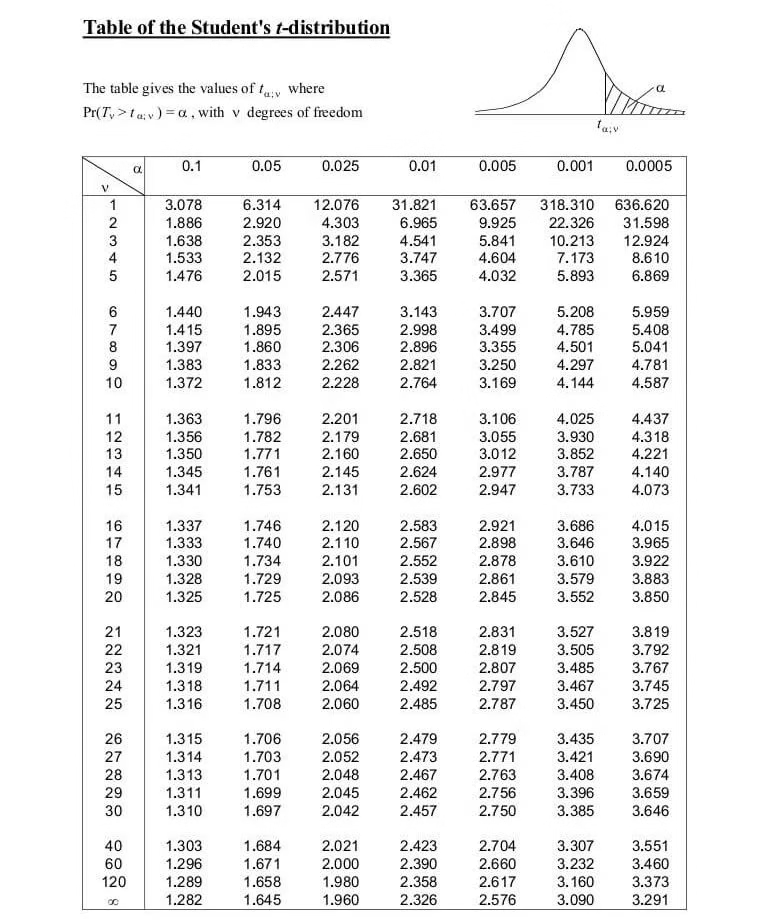
A. Finding P-value from a T-test
- Perform the t-test → get t-score.
- Calculate degrees of freedom (df = n − 1).
- Look up the t-table row corresponding to the df.
- Match the t-score in the row → get probability.
- If two-tailed → double the probability.
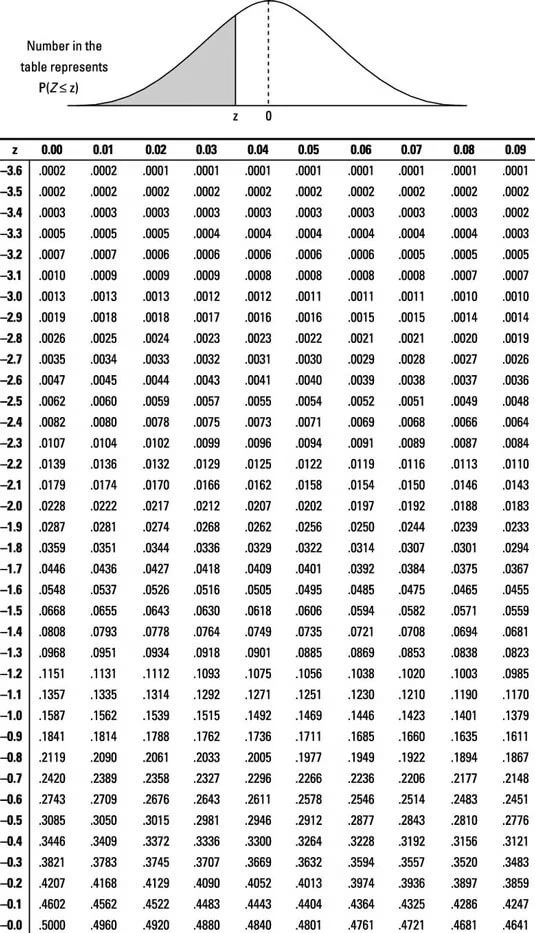
B. Finding P-value from a Z-test
- Perform z-test → get z-score.
- Enter the z-table.
- The first two digits (including a minus sign) go to the rows.
- The hundredth place goes to the columns.
- Match both to get the probability.
- For two-tailed → multiply by 2.
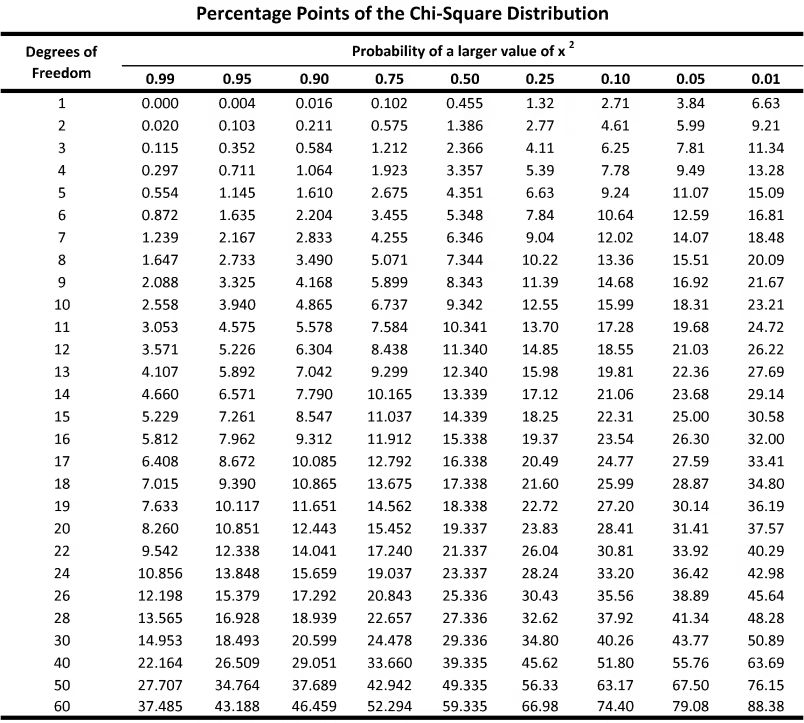
C. Finding P-value from Chi-square Test
- Obtain the chi-square statistic (χ²).
- Compute degrees of freedom:
df=(r−1)(c−1)
- Enter the chi-square table.
- Locate the χ² value and find the probability range.
- That probability is the P-value.
7. Interpretation of the P-value
The P-value is compared with a significance level (α), usually 0.05.
A. P-value less than 0.05 (< 0.05)
- Strong evidence against the null hypothesis.
- Null hypothesis is rejected.
- Result is statistically significant.
Meaning: The observed results are unlikely to have occurred by chance.
B. P-value greater than 0.05 (> 0.05)
- Weak evidence against the null hypothesis.
- Fail to reject the null hypothesis.
- Result is not statistically significant.
Meaning: The observed results can be explained by random chance.
C. P-value equal to 0.05 (= 0.05)
- Right at the threshold of significance.
- Decision depends on study context, but often still considered significant.
8. Importance of the P-value in Research
- Provides a standard measure of significance.
- Allows researchers from different countries/disciplines to interpret results in the same way.
- Helps decide whether observed differences are real or random.
- Supports reliable scientific conclusions.
- Used in almost all forms of statistical hypothesis testing.
9. Misconceptions About P-value
Many beginners misunderstand the P-value. Here are common wrong interpretations:
Misconception 1:
“P-value is the chance that the null hypothesis is true.”
Truth: P-value does NOT tell whether H₀ is true or false.
Misconception 2:
“A high P-value proves the null hypothesis.”
No. It only suggests insufficient evidence to reject H₀.
Misconception 3:
“A P-value of 0.03 means there is a 3% chance H₀ is true.”
➡Wrong. It means that if H₀ were true, the chance of observing such data is 3%.
10. Practical Applications of P-value
A. Biology
- Testing effects of fertilizers on plant growth.
- Analyzing enzyme activity under different temperatures.
- Comparing two species’ mean traits.
B. Medicine
- Testing drug effectiveness.
- Comparing patient recovery rates.
C. Environmental Science
- Studying pollution levels before/after policy changes.
D. Education
- Comparing student performance from two teaching methods.
E. Business & Marketing
- Checking differences in customer satisfaction.
11. Summary of P-value Interpretation
| P-value | Interpretation | Action |
| < 0.01 | Very strong evidence against H₀ | Reject H₀ |
| < 0.05 | Strong evidence against H₀ | Reject H₀ |
| 0.05–0.10 | Weak evidence | Inconclusive |
| > 0.10 | No evidence | Fail to reject H₀ |
12. Conclusion
The P-value is one of the most important tools in statistical hypothesis testing. It helps researchers understand whether their results are statistically significant and whether the observed differences are meaningful or simply due to chance.
Because P-values can be calculated from t-tests, z-tests, chi-square tests, and other statistical tests, they offer a universal language of statistical interpretation for scientists around the world.
A good understanding of P-values is essential for conducting reliable and credible research in biology, medical science, psychology, and all scientific fields.
Frequently Asked Questions (FAQs) on P-value in Research Methodology
1. What is a P-value in simple words?
A P-value tells how likely it is to get the observed results if the null hypothesis (H₀) is true.
A small P-value means the results are unlikely due to chance.
2. Why is the P-value important in research?
The P-value helps decide whether the results of a study are statistically significant. It guides researchers to reject or accept the null hypothesis.
3. What is considered a “significant” P-value?
The commonly accepted significance level is:
- P < 0.05 → Statistically significant
- P < 0.01 → Highly significant
4. Does a small P-value prove the alternative hypothesis?
No. A small P-value only provides strong evidence against the null hypothesis. It does not fully prove the alternative hypothesis.
5. What does P > 0.05 mean?
If the P-value is greater than 0.05, it means the results are not statistically significant.
We fail to reject the null hypothesis.
6. Is P-value the probability that the hypothesis is true?
No. This is a common misconception. The P-value does not tell whether the hypothesis is true or false.
It only tells how surprising the data is if the null hypothesis were true.
7. Can P-values be greater than 1 or negative?
Never.
P-values always range between 0 and 1.
8. What is the difference between P-value and significance level (α)?
- P-value comes from the data.
- α (alpha) is chosen before the experiment (usually 0.05).
If P ≤ α, the result is significant.
9. How is the P-value calculated?
The P-value is calculated using a test statistic like:
- t (from t-test)
- z (from z-test)
- χ² (from chi-square test)
- F (from ANOVA)
The probability corresponding to the statistic gives the P-value.
10. What does a P-value of 0.03 mean?
A P-value of 0.03 means that if the null hypothesis is true, there is a 3% chance of obtaining results like the observed ones.
Since 0.03 < 0.05, the result is statistically significant.
11. What does a P-value of 0.5 mean?
A P-value of 0.5 implies a 50% probability of getting the observed result under the null hypothesis.
This means the data is consistent with the null hypothesis and not significant.
12. Is a lower P-value always better?
Not always.
A very low P-value (< 0.001) indicates strong evidence against H₀, but it does not measure the size or importance of the effect.
Effect size must also be considered.
13. What is the P-value used for in biology?
In biological research, the P-value helps to:
- Test drug effectiveness
- Compare growth rates
- Analyze genetic variation
- Study differences between experimental groups
14. What is the P-value in a two-tailed test?
In a two-tailed test, the P-value represents the probability of observing values in both directions (higher or lower than expected).
So, probabilities from both ends of the distribution are added.
15. Can the P-value alone determine research conclusions?
No.
Research conclusions should consider:
- P-value
- Effect size
- Sample size
- Study design
- Practical significance
16. What is the most common mistake made with P-values?
The biggest mistake is assuming:
“A high P-value proves the null hypothesis.”
It does not. It only means insufficient evidence to reject the null.
17. Can I use P-values for large sample sizes?
Yes.
But for large samples, even tiny differences can give significant P-values.
So researchers also check effect size.
18. What does P = 0.000 mean?
In software output, P = 0.000 means P-value < 0.0001.
It does not literally mean zero—it means the result is extremely significant.
19. Which tests use P-values?
Almost all hypothesis tests use P-values, including:
- t-test
- z-test
- chi-square test
- ANOVA
- regression analysis
- correlation tests
- proportion tests
20. Is P-value the same as confidence level?
No.
- P-value tests the hypothesis.
- Confidence intervals estimate the range of true values.
Both are related but not identical.
References and Sources
- C.R. Kothari (1990) Research Methodology. Vishwa Prakasan. India.
- https://www.khanacademy.org/math/ap-statistics/tests-significance-ap/one-sample-t-test-mean/v/calculating-p-value-from-t-statistic
- https://www.khanacademy.org/math/ap-statistics/tests-significance-ap/one-sample-z-test-proportion/v/calculating-p-value-from-z-table
- https://www.graphpad.com/guides/prism/latest/statistics/stat_interpreting_results_contingen_2_2.htm
- https://www.itl.nist.gov/div898/handbook/eda/section3/eda3674.htm
- https://www.investopedia.com/terms/p/p-value.asp
- https://towardsdatascience.com/hypothesis-testing-in-3-steps-c23789e92a09
Read also:
ANOVA in Research Methodology – Definition, Types, Table, Examples, and Applications
Z-test in Research Methodology – Definition, Formula, Types, Examples, and Applications
Data in Research Methodology – Definition, Types, Classification, and Examples
T-test in Research Methodology – Definition, Formula, Types, Examples, and Applications