Statistical tests are the backbone of research methodology because they help researchers analyze and interpret data in a meaningful way. One of the most important tests used across biology, medicine, psychology, education, and business research is ANOVA (Analysis of Variance).
This article provides a detailed explanation of ANOVA, including its definition, principles, types (one-way and two-way ANOVA), assumptions, ANOVA table, examples, advantages, and applications.
1. What is ANOVA?
- ANOVA (Analysis of Variance) is a statistical method used to compare the means of three or more groups and determine whether there are significant differences among them.
- Instead of comparing groups one by one with multiple t-tests, ANOVA provides a single test that checks whether at least one group mean is different.
- It works by analyzing the variance (spread of data) and dividing it into different sources:
- Variance caused by chance/random error
- Variance caused by specific factors (treatments, groups, or conditions)
Example: A biologist wants to know whether different fertilizers affect crop yield. Instead of comparing each fertilizer separately with multiple tests, ANOVA can test all fertilizers in one analysis.
2. Principle of ANOVA
ANOVA is based on the principle that:
- Total variation in data = Variation between groups + Variation within groups
- Between-group variation: Differences in group means due to the effect of the independent variable (treatment).
- Within-group variation: Differences among individuals within the same group, due to chance or random error.
If between-group variation is much larger than within-group variation, it indicates that the treatment or factor has a significant effect.
3. Assumptions of ANOVA
For ANOVA to give valid results, some assumptions must be satisfied:
- Normality: The data in each group should be approximately normally distributed.
- Homogeneity of Variance: Variances of all groups should be roughly equal.
- Independence: Observations must be independent of each other.
- Random Sampling: Data should be collected randomly to avoid bias.
4. Types of ANOVA
There are mainly two types of ANOVA commonly used in research:
A. One-way ANOVA
- Used when there is one independent variable (factor) and one dependent variable.
- Helps determine if there are significant differences among the means of three or more groups.
- Example: Comparing the exam performance of students based on different levels of test anxiety.
Limitations of One-way ANOVA:
- It tells us that at least two groups are different, but not which groups differ. Post-hoc tests (like Tukey’s HSD) are required for detailed comparisons.
- If there are only two groups, a t-test is sufficient instead of ANOVA.
Relation with t-test:
B. Two-way ANOVA
- Used when there are two independent variables (factors) and one dependent variable.
- Helps in analyzing the effect of each independent variable individually and also whether they interact with each other.
- Example: Studying agricultural yield where:
- Independent variable 1 = Seed type
- Independent variable 2 = Fertilizer type
- Dependent variable = Crop output
Two-way ANOVA not only shows the effect of seeds and fertilizers separately but also whether the combination of a certain seed and fertilizer has a unique effect.
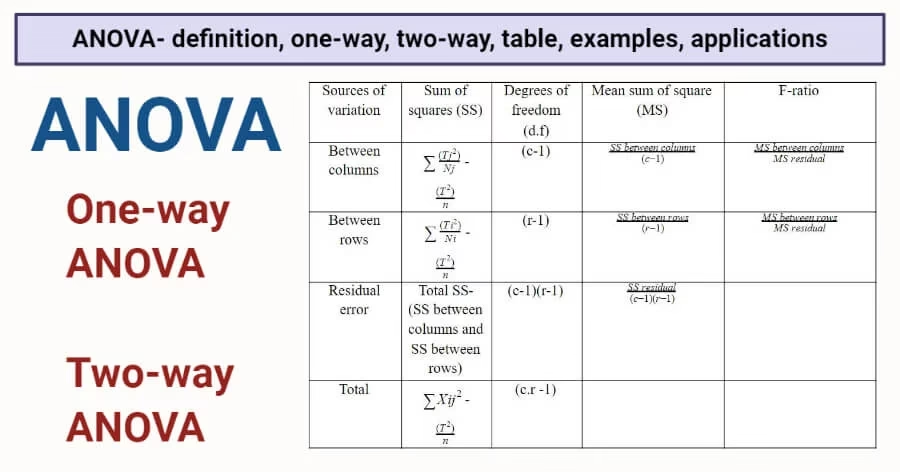
5. ANOVA Table
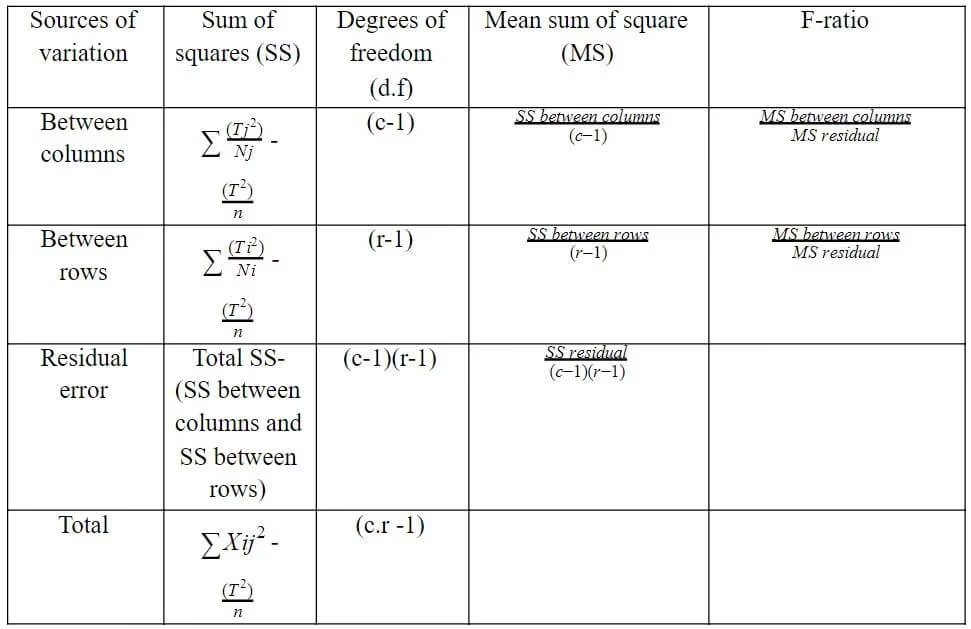
In the table,
c= number of columns
r= number of rows
T= the total of the values of individual items
Tj= the sum of the values in the column
Ti= the sum of the values in the row
- F-ratio: Compares between-group variance to within-group variance.
- If calculated F > critical F from F-table, the null hypothesis is rejected.
6. Steps in Performing ANOVA
- Define null hypothesis (H0): All group means are equal.
- Define alternative hypothesis (H1): At least one group mean is different.
- Calculate the Sum of Squares (SS) for between and within groups.
- Compute Mean Squares (MS).
- Calculate the F-ratio (MS between ÷ MS within).
- Compare calculated F with table value at a chosen significance level (α = 0.05).
- Draw conclusion.
7. Examples of ANOVA
Example 1 – One-way ANOVA
A psychologist studies exam performance in three groups of students based on test anxiety levels (low, medium, high). ANOVA helps determine if anxiety significantly affects performance.
Example 2 – Two-way ANOVA
An agricultural researcher tests the effect of two types of seeds and three types of fertilizers on crop yield. Two-way ANOVA helps identify both individual effects and interaction effects.
Example 3 – Biology Research
Studying whether different pH levels of soil influence the growth of a plant species. ANOVA helps compare growth across different soil conditions.
8. Applications of ANOVA
ANOVA is widely used in different fields:
- Biology: Comparing effects of treatments, fertilizers, or drugs on growth, health, or reproduction.
- Medicine: Testing differences in drug effectiveness among patient groups.
- Psychology & Education: Comparing performance across teaching methods or anxiety levels.
- Sociology: Studying differences in behavior across social groups.
- Business/Industry: Comparing product performance, market surveys, or sales strategies.
- Agriculture: Evaluating crop yield under different environmental conditions.
9. Advantages of ANOVA
- Can compare three or more groups at once.
- Prevents error inflation from multiple t-tests.
- Helps analyze both main effects and interactions (two-way ANOVA).
- Widely applicable in different fields of research.
10. Limitations of ANOVA
- Assumes normality and equal variances (violations affect results).
- Cannot tell which specific groups differ (post-hoc tests needed).
- Sensitive to outliers.
- Works best with balanced sample sizes.
11. Conclusion
ANOVA (Analysis of Variance) is a powerful statistical technique that helps researchers determine whether differences among group means are real or due to chance.
- One-way ANOVA is used when comparing one factor with multiple groups.
- Two-way ANOVA is used when two independent factors are studied simultaneously.
- Results are presented in an ANOVA table with F-ratios for decision-making.
For biology and other research fields, ANOVA provides a reliable way to analyze experiments, compare treatments, and understand patterns in data.
Frequently Asked Questions (FAQs) on ANOVA in Research Methodology
1. What is ANOVA in simple terms?
Ans: ANOVA (Analysis of Variance) is a statistical method used to compare the means of three or more groups to see if they are significantly different from each other.
2. What is the main purpose of ANOVA?
Ans: The main purpose of ANOVA is to check whether the differences between group means are real or just due to chance. It helps in hypothesis testing.
3. What are the types of ANOVA?
Ans: The two most common types are:
- One-way ANOVA: Used when there is only one independent variable.
- Two-way ANOVA: Used when there are two independent variables and their interaction is also studied.
4. What are the assumptions of ANOVA?
Ans: ANOVA is based on these assumptions:
- Data is normally distributed.
- Variances of groups are equal (homogeneity).
- Observations are independent.
- Samples are collected randomly.
5. How is ANOVA different from a t-test?
Ans:
- A t-test compares means of only two groups.
- ANOVA can compare means of three or more groups in one analysis, making it more efficient.
6. What is the F-ratio in ANOVA?
Ans: The F-ratio is the test statistic in ANOVA. It is the ratio of variance between groups to variance within groups.
- A large F-value indicates that the group means are significantly different.
7. Can ANOVA tell which groups are different?
Ans: No. ANOVA only tells if there is a significant difference among groups, not exactly which groups differ. To find this, researchers perform post-hoc tests (like Tukey’s test, Bonferroni test).
8. What are some real-life examples of ANOVA?
Ans:
- Comparing crop yield with different fertilizers.
- Testing drug effectiveness in different patient groups.
- Comparing student performance under different teaching methods.
- Studying consumer preferences across multiple brands.
9. What are the advantages of ANOVA?
Ans:
- Can compare 3 or more groups at once.
- Prevents error inflation from multiple t-tests.
- Analyzes interactions between variables (in two-way ANOVA).
- Widely applicable in biology, medicine, psychology, education, and business.
10. What are the limitations of ANOVA?
Ans:
- Requires normality and equal variances.
- Sensitive to outliers.
- Does not tell which groups differ without additional tests.
References and Sources
- C.R. Kothari (1990) Research Methodology. Vishwa Prakasan. India.
- https://statistics.laerd.com/spss-tutorials/one-way-anova-using-spss-statistics.php
- https://quizlet.com/88321005/anova-one-way-flash-cards/
- https://microbenotes.com/anova/
- https://www.wyzant.com/resources/answers/43247/the_larger_the_value_of_the_calculated_f_ratio
- https://www.wisegeek.com/what-are-the-different-types-of-agricultural-products.htm
- https://www.slideshare.net/sonustar3/anova-analysis-of-variance-90850361
- https://www.cliffsnotes.com/study-guides/statistics/univariate-inferential-tests/two-sample-t-test-for-comparing-two-means
Read also:
Z-test in Research Methodology – Definition, Formula, Types, Examples, and Applications
Data in Research Methodology – Definition, Types, Classification, and Examples
T-test in Research Methodology – Definition, Formula, Types, Examples, and Applications
P-value in Research Methodology – Definition, Formula, Interpretation, Examples, and Applications