In research methodology, one of the most widely used statistical tools for hypothesis testing is the T-test. It helps researchers determine whether there is a significant difference between the means of two groups or between a sample mean and a population mean.
The T-test is especially useful when the sample size is small (n ≤ 30) and the population standard deviation is unknown. This makes it an essential technique in biological, medical, psychological, and social science research.
1. What is a T-test?
The T-test is a statistical test used to compare means and check whether the difference observed between two datasets is statistically significant or due to random variation.
In simpler terms, it helps answer questions like:
- Is there a difference in the mean heights of male and female students?
- Does a new fertilizer increase crop yield compared to the old one?
- Is the mean blood pressure of a sample of patients different from the normal population average?
2. Key Features of T-test
- Based on the t-distribution, developed by William Sealy Gosset under the pseudonym “Student.”
- Used when the sample size is small (≤30).
- Applied when the population standard deviation (σ) is unknown.
- Compares means to identify statistically significant differences.
- Helps in testing hypotheses about population parameters.
3. When to Use a T-test
You can use a T-test when:
- The sample size is small (usually less than 30).
- The data approximately follows a normal distribution.
- You are testing hypotheses about means.
- The population standard deviation is unknown.
4. Formula for T-test
The basic formula for the T-test is:
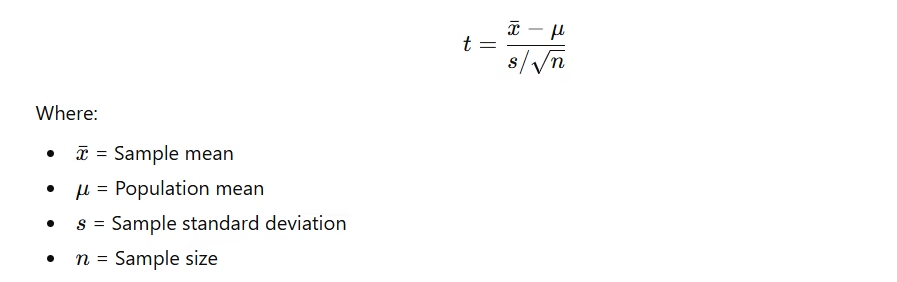
This formula calculates the t-value, which is then compared to the critical t-value from a t-distribution table at a specific significance level (α), such as 0.05 or 0.01.
5. Hypothesis Testing in T-test
Every T-test starts with two hypotheses:
- Null Hypothesis (H₀): There is no significant difference between means.
- Alternative Hypothesis (H₁): There is a significant difference between means.
The researcher calculates the t-value and compares it with the critical value from the t-table.
- If calculated t > critical t, reject H₀.
- If calculated t ≤ critical t, fail to reject H₀.
6. Types of T-tests
The T-test can be classified into different types based on research objectives:
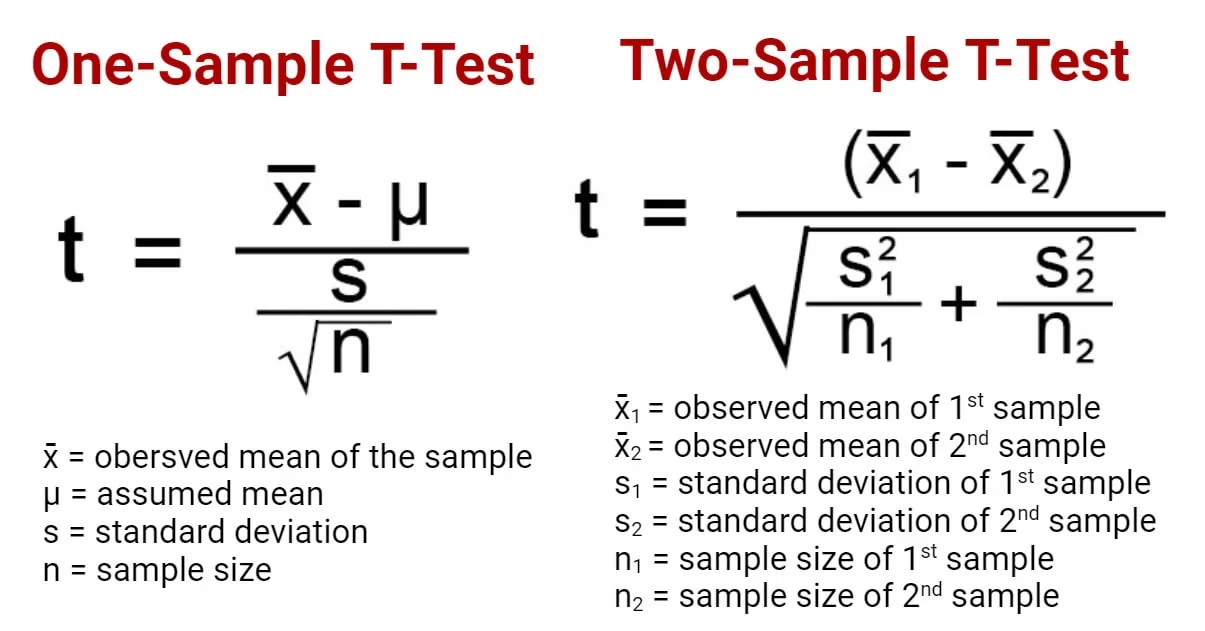
(A) One-sample T-test
- Used to determine whether the sample mean differs significantly from a known population mean.
- Ideal for comparing one group’s performance to a known standard or benchmark.

Example:
A biologist wants to test whether the average height of a plant species in a region differs from the standard height of 30 cm.
If the calculated t-value exceeds the critical value, it means the average plant height is significantly different.
(B) Two-sample T-test (Independent samples)
- Used to compare the means of two independent groups to determine whether the population means are significantly different.
- The samples must be independent of each other.

Example:
Comparing the average blood sugar level of two different patient groups – one treated with Drug A and another with Drug B.
If t is greater than the critical value, we conclude that the two drugs have significantly different effects.
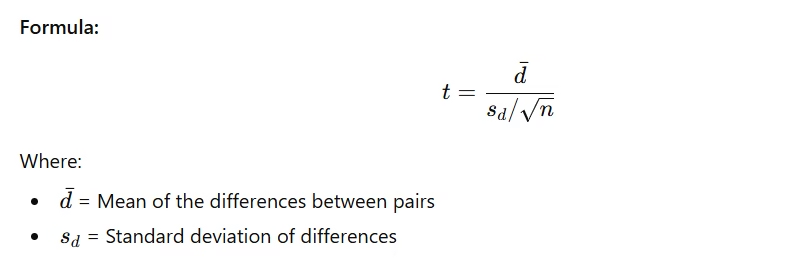
(C) Paired (Dependent) T-test
- Used when two sets of observations are taken from the same subjects before and after a treatment or under two conditions.
- Measures the difference in means of the paired observations.
Example:
Testing the difference in body weight of patients before and after a diet program.
If the calculated t-value exceeds the critical value, it indicates the diet has a significant effect.
7. One-tailed vs Two-tailed T-tests
➤ One-tailed T-test
- The critical region is on one side of the distribution.
- Used when the research hypothesis predicts the direction of the difference (greater or lesser).
- Example: Testing if a new fertilizer produces higher yield than the standard one.
➤ Two-tailed T-test
- The critical regions are on both sides of the distribution.
- Used when the direction of difference is not predicted.
- Example: Testing if two teaching methods produce different student performance levels (could be higher or lower).
8. Steps in Conducting a T-test
- Formulate hypotheses: H₀ and H₁.
- Set the significance level (α): Usually 0.05.
- Collect and summarize data: Calculate sample mean and standard deviation.
- Compute t-value using the formula.
- Find critical t-value from the t-table based on degrees of freedom (df = n-1).
- Compare values:
- If |t| > critical t → Reject H₀.
- If |t| ≤ critical t → Fail to reject H₀.
- Draw conclusions based on results.
9. Applications of T-test in Research
The T-test is one of the most commonly applied tools in many scientific fields:
Biology and Medicine
- Comparing drug effectiveness.
- Measuring enzyme activity under different conditions.
- Comparing growth rates between treated and control plants.
Psychology and Education
- Comparing test scores before and after training.
- Studying behavioral changes due to interventions.
Business and Economics
- Comparing sales performance of two marketing campaigns.
- Testing differences in customer satisfaction levels.
Environmental Studies
- Checking if pollution levels differ before and after an industrial regulation.
10. Advantages of the T-test
- Suitable for small samples.
- Simple and easy to calculate.
- Useful for testing mean differences.
- Requires only sample data, not population parameters.
- Can be applied to both independent and dependent samples.
11. Limitations of the T-test
- Assumes normal distribution of data.
- Not suitable for very large samples (Z-test preferred).
- Sensitive to outliers.
- Assumes equal variances in two-sample tests.
12. Difference Between T-test, Z-test, and F-test
| Feature | T-test | Z-test | F-test |
| Sample Size | Small (≤30) | Large (>30) | Any |
| Distribution | t-distribution | Normal | F-distribution |
| Population Variance | Unknown | Known | Ratio of variances |
| Purpose | Compare means | Compare means | Compare variances |
| Common Uses | Biology, medicine | Surveys, population studies | ANOVA, regression |
13. Conclusion
The T-test is a powerful statistical tool used to test whether the means of two datasets are significantly different. It is widely used in research methodology when working with small samples and unknown population variance.
Understanding its types — one-sample, independent, and paired T-tests — allows researchers to choose the right test for their data.
In biological and social research, the T-test remains one of the most fundamental methods for hypothesis testing and statistical inference.
Frequently Asked Questions (FAQs) on T-test in Research Methodology
1. What is a T-test in simple words?
A T-test is a statistical test used to determine whether there is a significant difference between the means of two groups or between a sample mean and a known population mean.
In short, it helps decide whether the observed differences are real or due to random chance.
2. When is a T-test used?
A T-test is used when:
- The sample size is small (n ≤ 30).
- The population standard deviation (σ) is unknown.
- The data approximately follows a normal distribution.
- The goal is to compare means between groups or samples.
3. What are the types of T-tests?
The main types of T-tests are:
- One-sample T-test – Compares a sample mean with a known population mean.
- Independent (two-sample) T-test – Compares means of two independent groups.
- Paired (dependent) T-test – Compares means from the same group before and after a treatment.
4. What is the difference between one-tailed and two-tailed T-tests?
- One-tailed T-test: Tests whether the mean is significantly greater or less than another mean (directional).
- Two-tailed T-test: Tests whether there is any difference, regardless of direction.
Example:
- One-tailed: “Is drug A more effective than drug B?”
- Two-tailed: “Is there a difference between drug A and drug B?”
5. What are the assumptions of the T-test?
For a T-test to be valid:
- The data should be approximately normally distributed.
- The samples must be randomly selected.
- The observations should be independent.
- In independent T-tests, variances must be equal (homogeneity of variance).
6. What is the difference between a T-test and a Z-test?
| Feature | T-test | Z-test |
| Sample Size | Small (≤ 30) | Large (> 30) |
| Population Standard Deviation | Unknown | Known |
| Distribution Type | t-distribution | Normal distribution |
| Usage | When variance is estimated from sample | When variance is known |
7. What does a significant T-test result mean?
A significant T-test result (p-value < 0.05) means that the difference between the groups is not due to random chance, and there is a statistically significant difference between the means.
8. What are some real-life examples of T-tests?
- Biology: Testing whether two plant species grow differently under different conditions.
- Medicine: Comparing blood pressure before and after taking a new drug.
- Education: Checking if two teaching methods result in different average marks.
- Business: Comparing sales performance of two marketing strategies.
9. What is the null hypothesis (H₀) in a T-test?
The null hypothesis (H₀) assumes that there is no significant difference between the means.
For example, H₀: “The average height of treated and untreated plants is the same.”
If the calculated t-value is greater than the critical t-value, the null hypothesis is rejected.
10. What is the role of the p-value in a T-test?
The p-value helps determine the strength of the results:
- If p < 0.05, reject H₀ → There is a significant difference.
- If p ≥ 0.05, fail to reject H₀ → No significant difference.
11. What are the advantages of using a T-test?
- Suitable for small samples.
- Simple and easy to apply.
- Effective for mean comparison.
- Works with both independent and paired data.
13. What are the limitations of the T-test?
- Not suitable for large samples (use Z-test instead).
- Assumes normal distribution of data.
- Sensitive to outliers.
- Only compares two groups at a time (for more, use ANOVA).
14. How is the T-test used in biological research?
In biology, the T-test is used to:
- Compare growth rates of plants or animals.
- Evaluate the impact of treatments or environmental conditions.
- Analyze differences in physiological parameters (like enzyme activity).
- Test the effectiveness of drugs or fertilizers.
15. What is the relation between T-test and F-test?
- The T-test compares two means.
- The F-test compares two or more variances (used in ANOVA).
In fact, when comparing two groups, t² = F, meaning they are closely related tests.
References and Sources
- R. Kothari (1990) Research Methodology. Vishwa Prakasan. India.
- https://www.investopedia.com/terms/o/one-tailed-test.asp
- https://towardsdatascience.com/hypothesis-testing-in-machine-learning-using-python-a0dc89e169ce
- https://en.wikipedia.org/wiki/Two-tailed_test
- https://www.scribbr.com/statistics/t-test/
- https://www.scalelive.com/null-hypothesis.html
- https://www.investopedia.com/terms/t/two-tailed-test.asp
- https://www.investopedia.com/ask/answers/073115/what-assumptions-are-made-when-conducting-ttest.asp
- https://microbenotes.com/t-test/
- https://www.chegg.com/homework-help/questions-and-answers/sample-100-steel-wires-average-breaking-strength-x-50-kn-standard-deviation-sigma-4-kn–fi-q20558661
Read also:
ANOVA in Research Methodology – Definition, Types, Table, Examples, and Applications
Z-test in Research Methodology – Definition, Formula, Types, Examples, and Applications
Data in Research Methodology – Definition, Types, Classification, and Examples
P-value in Research Methodology – Definition, Formula, Interpretation, Examples, and Applications