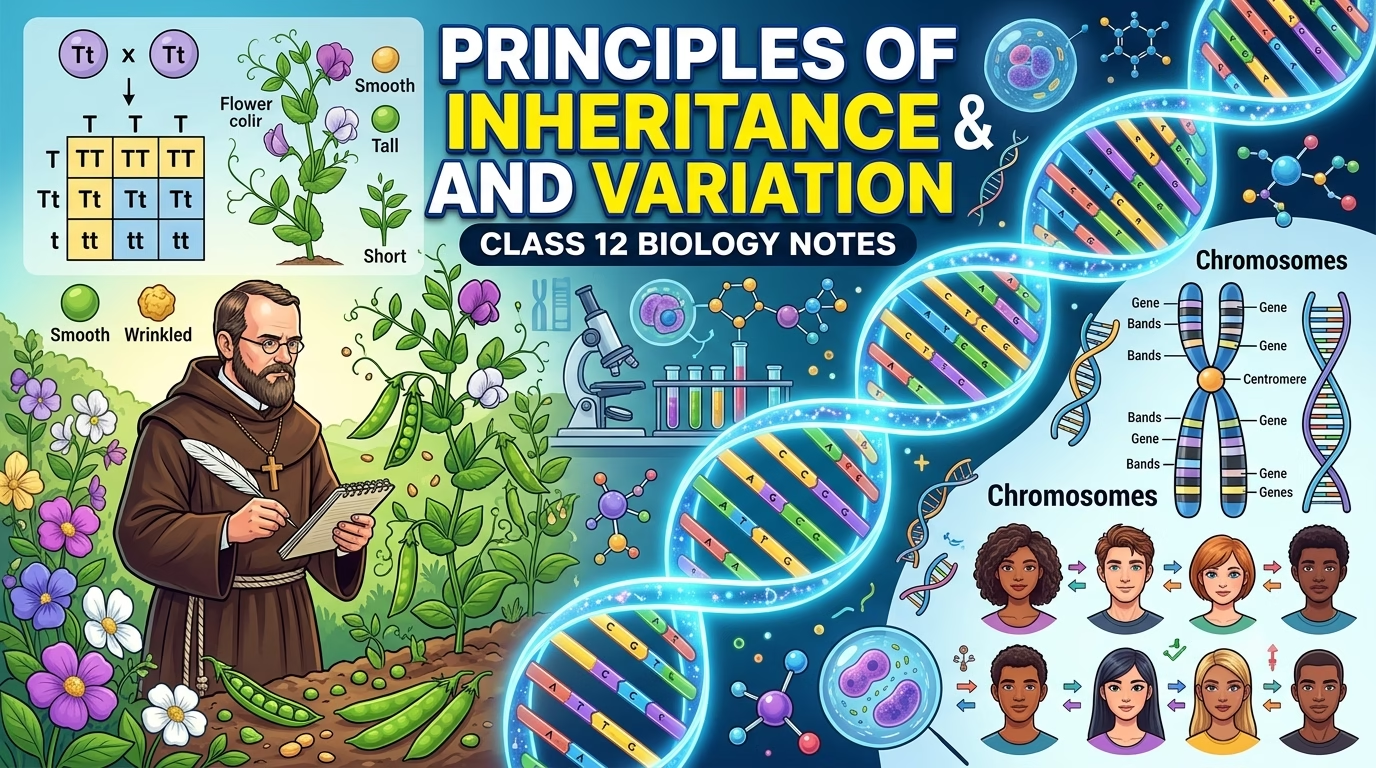
Genetics is one of the most scoring — and most fascinating — chapters in Class 12 Biology. It explains how traits like height, flower colour, and even certain diseases pass from parents to their children, and why no two siblings (except identical twins) ever look exactly alike. This guide breaks down every important concept in the chapter Principles of Inheritance and Variation, from Mendel’s pea plant experiments to modern chromosomal disorders, in an easy-to-revise format.
What is Genetics?
Genetics is the branch of biology that studies heredity (inheritance) and variation in living organisms.
- Inheritance: the process by which characters or traits are transmitted from parents to offspring.
- Variation: the degree to which offspring differ from their parents and from one another.
Together, inheritance and variation explain both the similarities and the differences we see between generations — and they form the biological basis of evolution.
Mendel’s Experiments: The Foundation of Genetics
Gregor Johann Mendel is widely regarded as the father of genetics. Working in a monastery garden in the 1860s, he conducted breeding experiments on the garden pea plant (Pisum sativum) and, from thousands of crosses, worked out the basic rules that govern how traits are inherited.
Why Mendel chose the garden pea
- Pea plants have several traits that exist in two clearly contrasting forms (e.g., tall vs. dwarf), making results easy to classify.
- They are naturally self-pollinating, but can also be easily cross-pollinated by hand.
- They have a short life cycle and produce a large number of offspring, giving Mendel a large sample size — which made his conclusions statistically reliable.
The seven traits Mendel studied
| S. No. | Character | Dominant Trait | Recessive Trait |
| 1 | Stem height | Tall | Dwarf |
| 2 | Flower colour | Violet | White |
| 3 | Flower position | Axial | Terminal |
| 4 | Pod shape | Inflated | Constricted |
| 5 | Pod colour | Green | Yellow |
| 6 | Seed shape | Round | Wrinkled |
| 7 | Seed colour | Yellow | Green |
Setting up the experiment
Mendel first developed true-breeding lines — plants that, on repeated self-pollination over several generations, always produced offspring identical to themselves for a given trait. He then selected pairs of true-breeding plants that differed in just one character (e.g., a true-breeding tall plant and a true-breeding dwarf plant) and cross-pollinated them artificially. This process is called hybridisation, and the resulting offspring form the first filial generation, or F1.
Monohybrid Cross and Inheritance of One Gene
A monohybrid cross studies the inheritance of a single character — for example, plant height alone.
What Mendel observed
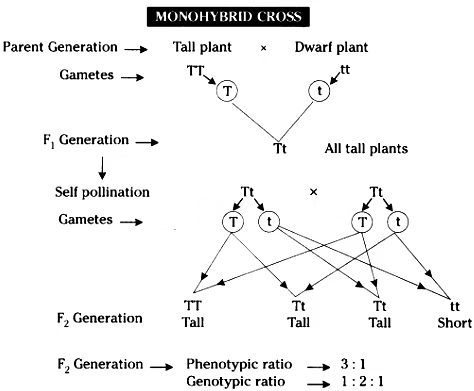
- When a true-breeding tall plant (TT) was crossed with a true-breeding dwarf plant (tt), all the F1 offspring were tall. The dwarf trait seemed to disappear.
- When two F1 plants (all Tt) were self-pollinated, the F2 generation showed both tall and dwarf plants — in a ratio of approximately 3 : 1.
This “reappearance” of the recessive trait in F2 was the key clue that led Mendel to conclude that hereditary information is carried by discrete, unchanging units — which he called factors, and which we today call genes.
Key genetic terms explained
- Alleles: alternative forms of the same gene, which produce contrasting versions of a trait (e.g., the “tall” allele and the “dwarf” allele of the height gene).
- Genotype: the actual genetic makeup of an organism (e.g., TT, Tt, tt).
- Phenotype: the physically observable trait (e.g., tall or dwarf).
- Homozygous: having two identical alleles for a gene (TT or tt).
- Heterozygous: having two different alleles for a gene (Tt).
- Dominant allele: the allele that expresses itself even when only one copy is present (e.g., T).
- Recessive allele: the allele whose effect is masked when a dominant allele is present, and which is expressed only in the homozygous recessive state (e.g., tt).
The monohybrid cross, step by step
Parents: TT (tall) × tt (dwarf)
F1: Tt (tall) — all plants
F1 selfed: Tt × Tt
F2: TT : Tt : Tt : tt → genotypic ratio 1 : 2 : 1
tall : tall : tall : dwarf → phenotypic ratio 3 : 1
Because a single dominant allele (T) is enough to produce the tall phenotype, three out of four F2 genotype combinations (TT, Tt, Tt) appear tall, while only the homozygous recessive (tt) appears dwarf.
The Punnett square
A Punnett square is a simple grid used to work out all the possible genotype combinations of offspring from a genetic cross. The possible gametes from one parent are listed along the top row, and those from the other parent down the left column; each box in the grid then shows one possible offspring genotype.
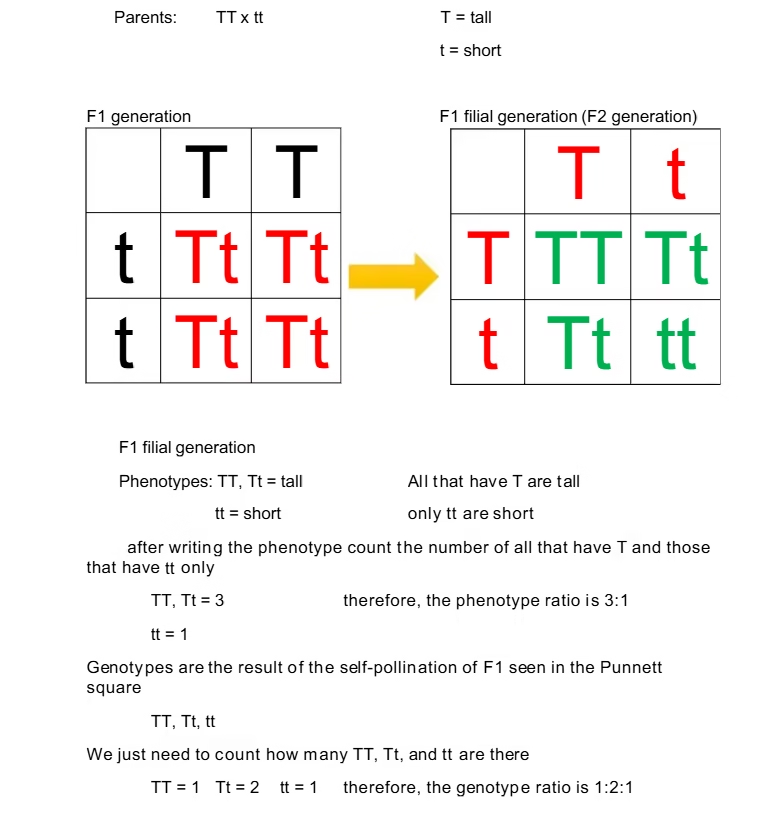
Mathematically, the 1 : 2 : 1 genotypic ratio can also be derived from the binomial expansion of (½T + ½t)², since each parent contributes each allele with an equal probability of ½:
(½T + ½t)² = ¼TT + ½Tt + ¼tt
Mendel’s Three Laws of Inheritance
Based on his results, Mendel proposed three fundamental laws. The Law of Dominance and Law of Segregation come from monohybrid crosses, while the Law of Independent Assortment comes from dihybrid crosses.
1. Law of Dominance
Characters are controlled by discrete units (factors/genes) that occur in pairs. When two contrasting alleles are present together, one (the dominant allele) suppresses the expression of the other (the recessive allele). This law explains why only one parental trait appears in F1, while both traits reappear in F2.
2. Law of Segregation
The two alleles of a gene pair separate (segregate) from each other during gamete formation, so that each gamete receives only one allele of the pair.
- A homozygous parent (TT or tt) produces only one type of gamete.
- A heterozygous parent (Tt) produces two types of gametes (T and t) in equal proportions.
This law is also called the Law of Purity of Gametes, since it ensures that alleles never “blend” — they remain distinct units passed from generation to generation.
3. Law of Independent Assortment
(explained in detail under Dihybrid Cross below)
Test Cross
A test cross is performed by crossing an individual showing the dominant phenotype (whose genotype is unknown) with a homozygous recessive individual. It is used to determine whether the dominant trait comes from a homozygous (TT) or heterozygous (Tt) genotype.
- TT × tt → all offspring are Tt (tall) — a uniform result indicates a homozygous dominant parent.
- Tt × tt → offspring are 50% Tt (tall) and 50% tt (dwarf) — a mixed result indicates a heterozygous parent.
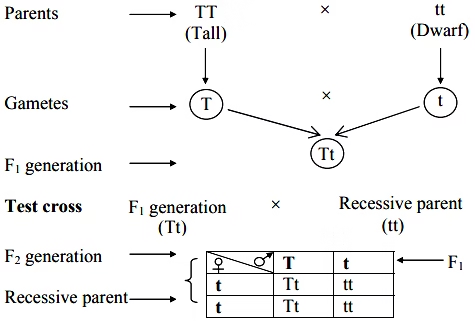
Test crosses remain an important practical tool in plant and animal breeding programmes today.
Incomplete Dominance
Not every trait follows simple dominant–recessive inheritance. In incomplete dominance, the F1 offspring shows a phenotype that is intermediate between the two parents, rather than resembling either one fully.
Classic example: Flower colour in four o’clock flower (Mirabilis jalapa)
| Genotype | Phenotype |
| RR | Red |
| rr | White |
| Rr | Pink |
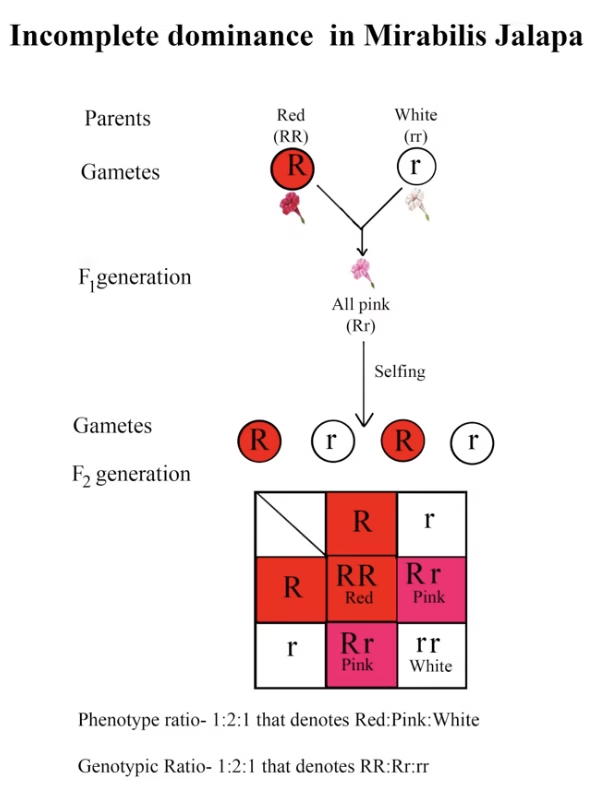
When a red-flowered (RR) plant is crossed with a white-flowered (rr) plant, all F1 plants are pink (Rr) — neither fully red nor white. On selfing the F1, the F2 generation shows:
- Genotypic ratio: 1 RR : 2 Rr : 1 rr (same as a typical Mendelian cross)
- Phenotypic ratio: 1 Red : 2 Pink : 1 White
Notice that the genotypic ratio stays the same as in a standard monohybrid cross, but the phenotypic ratio changes because the dominant allele (R) is not fully dominant over the recessive allele (r).
What Causes Dominance? (Molecular Basis)
At the molecular level, every gene in a diploid organism exists as two copies, which may or may not be identical.
- A normal (dominant) gene produces a functional product, P.
- An altered (recessive/mutant) version of the same gene may produce a non-functional product (P′) or no product at all.
- Because the altered gene cannot perform the normal function, it fails to influence the phenotype when a normal copy is also present — this is why it is “recessive,” while the functional gene is “dominant.”
Co-dominance
In co-dominance, both alleles of a gene are fully and simultaneously expressed in the heterozygote — the F1 offspring resembles both parents rather than showing an intermediate phenotype.
Classic example: ABO blood grouping in humans
The ABO blood group system is controlled by a single gene, I, which has three alleles: I^A, I^B, and i. Since every person inherits only two of these three alleles, ABO blood group is a textbook example of multiple alleles (more than two alleles controlling one character) as well as co-dominance.
- I^A and I^B are both dominant over i.
- I^A and I^B are co-dominant with each other — when both are present, both are expressed.
- I^A and I^B alleles produce distinct sugar molecules (A-type and B-type antigens) on red blood cells; the i allele produces no such sugar.
| Allele from Parent 1 | Allele from Parent 2 | Genotype of Offspring | Blood Type |
| I^A | I^A | I^A I^A | A |
| I^A | I^B | I^A I^B | AB |
| I^A | i | I^A i | A |
| I^B | I^A | I^A I^B | AB |
| I^B | I^B | I^B I^B | B |
| I^B | i | I^B i | B |
| i | i | ii | O |
Multiple alleles like these are especially useful in population genetics studies, since they show how a gene can have more variety than a simple dominant/recessive pair.
Dihybrid Cross and the Law of Independent Assortment
A dihybrid cross tracks the inheritance of two characters simultaneously — for instance, seed shape and seed colour, where round and yellow seeds are dominant over wrinkled and green seeds.
Mendel’s dihybrid cross experiment
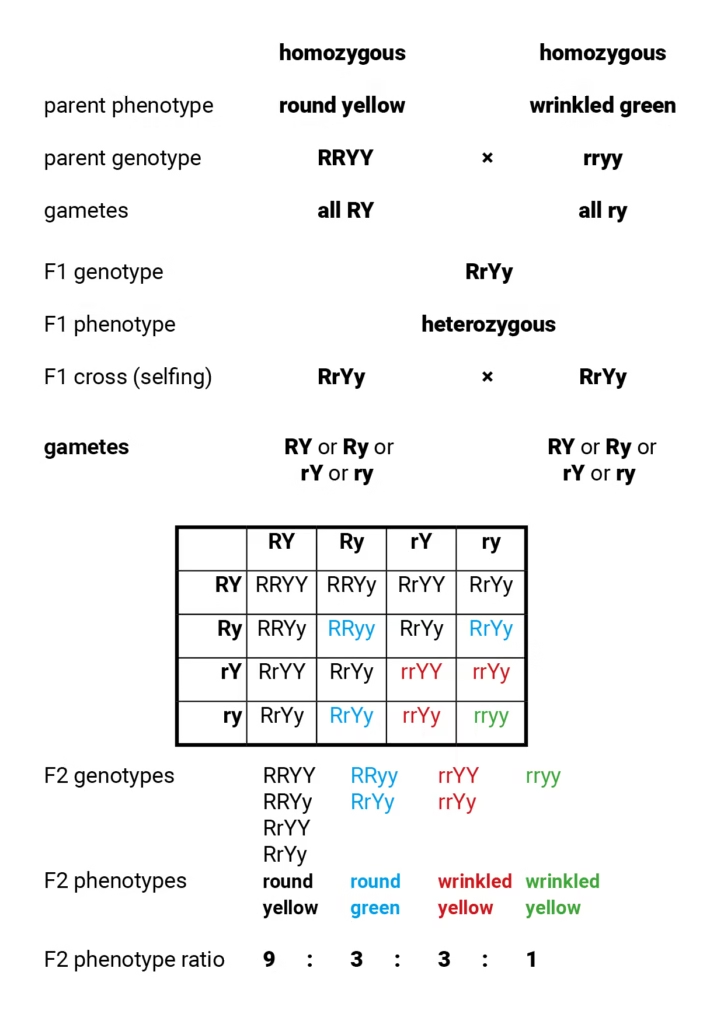
Mendel crossed a plant with round, yellow seeds (RRYY) with one having wrinkled, green seeds (rryy):
Parents: RRYY (round, yellow) × rryy (wrinkled, green)
F1: RrYy (round, yellow) — all plants
F1 selfed: RrYy × RrYy
F2: 9 Round Yellow : 3 Round Green : 3 Wrinkled Yellow : 1 Wrinkled Green
The F2 phenotypic ratio of 9 : 3 : 3 : 1 is the hallmark result of a standard dihybrid cross, and it is derived using a 4×4 Punnett square built from the four gamete types (RY, Ry, rY, ry) produced by the F1 heterozygotes.
Law of Independent Assortment
When two pairs of traits are combined in a hybrid, the alleles of one gene pair segregate independently of the alleles of the other gene pair during gamete formation. As a result, all four gamete combinations (RY, Ry, rY, ry) are produced in equal proportion (25% each).
This law holds true specifically for genes located on different chromosomes (or far apart on the same chromosome) — a fact that later became important when linkage was discovered (see below).
Chromosomal Theory of Inheritance
Rediscovery of Mendel’s work
Although Mendel published his findings in 1866, they remained largely unnoticed for over three decades because:
- He lacked strong scientific communication channels and publicity for his work.
- His idea of discrete, unblending hereditary “factors” conflicted with the prevailing belief that variation in nature was continuous and blending.
- His unusually mathematical, statistical approach to a biological problem was unfamiliar to biologists of his time.
It was only in 1900 that three scientists — Hugo de Vries, Carl Correns, and Erich von Tschermak — independently rediscovered and confirmed Mendel’s principles.
Linking chromosomes to genes
By 1900, improvements in microscopy had allowed scientists to observe chromosomes inside dividing cells. Walter Sutton and Theodor Boveri noticed a striking parallel: chromosomes, like Mendel’s factors, occur in pairs, and behave in ways that mirror the segregation and independent assortment of genetic factors.
They proposed that:
- The two alleles of a gene lie at the same position (locus) on homologous chromosomes.
- It is the physical pairing and subsequent separation of homologous chromosomes during meiosis that causes the segregation of the allele pairs they carry.
This synthesis of chromosome behaviour with Mendelian genetics became known as the Chromosomal Theory of Inheritance.
Linkage and Recombination: Morgan’s Experiments on Drosophila
Thomas Hunt Morgan used the fruit fly, Drosophila melanogaster, to study how genes are physically arranged on chromosomes. Drosophila proved to be an ideal model organism because it:
- Can be reared easily on a synthetic laboratory medium.
- Completes its life cycle in about two weeks, allowing many generations to be studied quickly.
- Produces a large number of offspring from a single mating.
- Shows clearly distinguishable males and females.
- Displays hereditary variations that are visible even under a low-power microscope.
The experiment
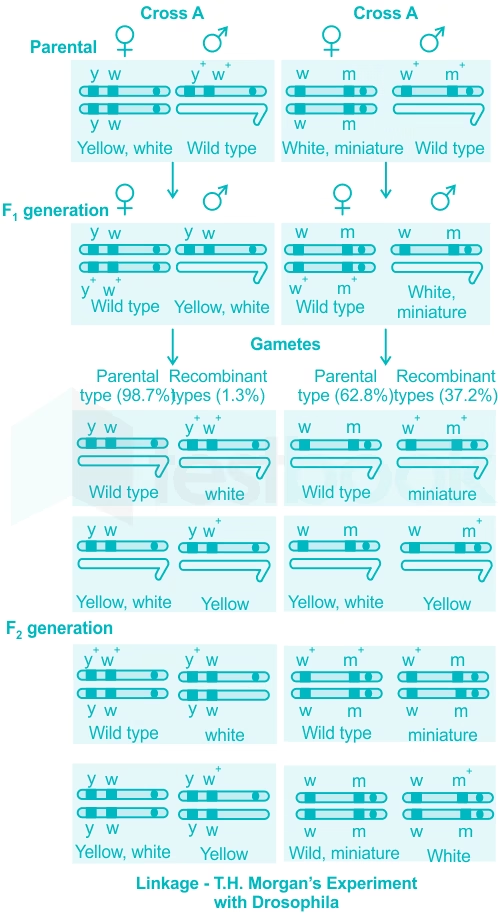
Morgan crossed yellow-bodied, white-eyed females with brown-bodied, red-eyed males. The resulting F1 flies were inter-crossed, and the F2 generation was examined — but instead of the expected 9 : 3 : 3 : 1 Mendelian dihybrid ratio, Morgan observed a markedly different ratio, with far more offspring showing the original parental combinations of traits than new, non-parental combinations.
Explaining the deviation
Morgan realised that the genes for body colour and eye colour were both located on the X chromosome — that is, they were physically linked on the same chromosome, rather than assorting independently as Mendel’s law would predict for genes on separate chromosomes.
- Linkage: the tendency of genes located on the same chromosome to be inherited together.
- Recombination: the generation of non-parental (new) combinations of traits in the offspring, caused by crossing over between homologous chromosomes during meiosis.
Genes that lie very close together on a chromosome show low recombination frequency (they are “tightly linked” — e.g., the yellow and white genes show only about 1.3% recombination), while genes that lie farther apart show higher recombination frequency (e.g., the white and miniature genes show about 37.2% recombination).
Genetic mapping
Alfred Sturtevant, a student of Morgan, realised that the frequency of recombination between two genes could be used as a measure of the physical distance between them on a chromosome — the farther apart two genes are, the more likely a crossover is to occur between them. Using this principle, he constructed the first genetic linkage maps. This mapping technique is still foundational to genome sequencing projects today, including the Human Genome Project.
Sex Determination in Animals, Including Humans
The discovery that chromosomes determine sex was one of the most important breakthroughs in genetics.
Henking, while studying spermatogenesis in insects, noticed a distinctive nuclear structure present in only half of all sperm cells. He called this the “X body,” not yet knowing its function. It was later identified as a chromosome and named the X chromosome. Chromosomes directly involved in determining an organism’s sex are called sex chromosomes; all other chromosomes are called autosomes.
XO type of sex determination
- Found in many insects.
- Only one type of sex chromosome (X) exists; there is no equivalent Y chromosome.
- Some sperm carry an X chromosome, while others carry none.
- Eggs fertilised by an X-bearing sperm develop into females (XX).
- Eggs fertilised by sperm lacking an X chromosome develop into males (XO).
XY type of sex determination
- Found in humans and Drosophila.
- Males possess one X and one distinctly smaller Y chromosome (XY).
- Females possess a pair of X chromosomes (XX).
Male vs. female heterogamety
- Male heterogamety: the male produces two different types of gametes with respect to sex chromosomes. Both the XO type (X-bearing or no-X sperm) and XY type (X-bearing or Y-bearing sperm) are examples.
- Female heterogamety: the female is the heterogametic sex. The ZW system, seen in birds and some other animals, is the classic example — females are ZW and males are ZZ.
Mutation
A mutation is any change in the sequence of DNA that alters the genotype, and consequently often the phenotype, of an organism. Because the DNA double helix runs continuously through a chromatid, any insertion or deletion in the DNA sequence directly affects the structure of the chromosome.
- Point mutation: a mutation caused by a change in a single base pair of DNA. Example: sickle cell anaemia.
- Frameshift mutation: a mutation caused by the insertion or deletion of one or more bases, which shifts the reading frame of the gene.
- Mutagens: physical or chemical agents that induce mutations, such as UV radiation, X-rays, and certain chemicals.
Pedigree Analysis
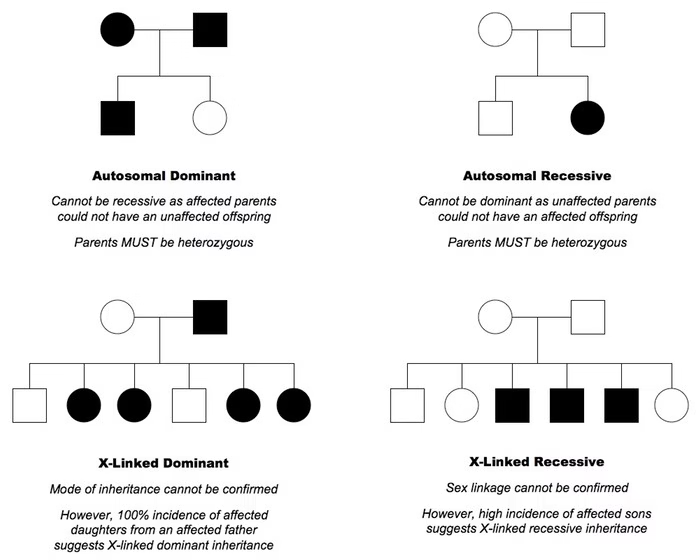
Pedigree analysis is the study of how a particular trait, abnormality, or genetic disease is inherited across multiple generations of a family, typically represented visually as a family tree. Since DNA is passed down largely unchanged from generation to generation, tracing a trait through a pedigree can reveal whether it follows a dominant, recessive, autosomal, or sex-linked pattern of inheritance.
Standard pedigree symbols
| Symbol | Meaning |
| Square | Male |
| Circle | Female |
| Diamond | Sex unspecified |
| Filled (coloured) shape | Affected individual |
| Horizontal line connecting two shapes | Mating |
| Double horizontal line | Consanguineous mating (between relatives) |
| Vertical line down from a couple | Children, arranged left to right in birth order |
Pedigree charts are widely used by genetic counsellors today to assess the risk of inherited disorders being passed on to future children in a family.
Genetic Disorders
Genetic disorders are broadly classified into two categories: Mendelian disorders, caused by mutation in a single gene, and chromosomal disorders, caused by an abnormal number or structure of chromosomes.
Mendelian disorders
Mendelian disorders follow the classic inheritance patterns described by Mendel and can be grouped as:
- Autosomal dominant — e.g., muscular dystrophy
- Autosomal recessive — e.g., sickle cell anaemia
- Sex-linked — e.g., haemophilia
Haemophilia
- A sex-linked recessive disorder in which the gene lies on the X chromosome.
- Typically transmitted from an unaffected carrier female to her male offspring.
- Females rarely show symptoms themselves, because a female would need to inherit the recessive allele from both a carrier mother and a haemophilic father to be affected.
- The disorder affects a protein essential for blood clotting, so even a minor injury can lead to prolonged, uncontrolled bleeding.
Sickle cell anaemia
- An autosomal recessive disorder controlled by a pair of alleles of the haemoglobin gene, Hb^A and Hb^S.
| Genotype | Phenotype |
| Hb^A Hb^A | Normal |
| Hb^A Hb^S | Carrier (usually unaffected) |
| Hb^S Hb^S | Affected (diseased) |
- Molecular cause: a single point mutation substitutes the base sequence GAG with GUG, which in turn causes glutamic acid to be replaced by valine at the sixth position of the beta-globin chain of haemoglobin.
- The resulting abnormal haemoglobin polymerises under low-oxygen conditions, distorting red blood cells into a rigid, sickle-like shape that impairs blood flow and oxygen delivery.
Phenylketonuria (PKU)
- An autosomal recessive metabolic disorder.
- Normally, the enzyme phenylalanine hydroxylase converts the amino acid phenylalanine into tyrosine. In PKU, the gene coding for this enzyme is mutated, so the enzyme is non-functional.
- Phenylalanine accumulates in the body and is converted instead into phenylpyruvic acid, which builds up in the brain and causes mental retardation if untreated.
- Because the kidneys reabsorb phenylpyruvic acid poorly, it is also excreted in the urine — which is how newborn screening tests for PKU.
Chromosomal disorders
Chromosomal disorders arise from abnormalities in the number or structure of chromosomes, usually due to errors during cell division.
- Normal human chromosome number: 46 (23 pairs) — 22 pairs of autosomes + 1 pair of sex chromosomes.
- Monosomy: the loss of one chromosome from a pair, leaving only a single copy.
- Trisomy: the presence of an extra (third) copy of a particular chromosome.
- Aneuploidy: an overall abnormal chromosome number caused by the failure of chromosomes (or chromatids) to separate properly during cell division — a phenomenon known as non-disjunction.
Down’s syndrome
- Cause: trisomy of chromosome 21 (an extra copy of chromosome 21).
- Features: short stature, a small and round head, a furrowed tongue, a partially open mouth, a distinctive palm crease, congenital heart defects, and varying degrees of mental retardation.
Klinefelter syndrome
- Cause: an extra X chromosome in males, resulting in a 47, XXY karyotype.
- Features: overall masculine development accompanied by feminising traits such as gynaecomastia (breast development); affected individuals are typically sterile.
Turner’s syndrome
- Cause: the complete absence of one X chromosome in females, resulting in a 45, XO karyotype.
- Features: affected females are sterile, have rudimentary (underdeveloped) ovaries, and lack normal secondary sexual characteristics.
Quick Revision Summary
- Mendel’s laws: Dominance, Segregation, Independent Assortment.
- Monohybrid cross ratio: phenotypic 3:1, genotypic 1:2:1.
- Dihybrid cross ratio: phenotypic 9:3:3:1.
- Incomplete dominance → intermediate phenotype (e.g., pink snapdragons).
- Co-dominance → both alleles expressed together (e.g., AB blood group).
- Chromosomal theory → genes are located on chromosomes (Sutton & Boveri).
- Linkage & recombination → discovered by Morgan using Drosophila; mapped by Sturtevant.
- Sex determination → XY/XO (male heterogamety) and ZW (female heterogamety).
- Mutation → point mutation vs. frameshift mutation.
- Genetic disorders → Mendelian (haemophilia, sickle cell anaemia, PKU) vs. chromosomal (Down’s, Klinefelter’s, Turner’s syndromes).
Frequently Asked Questions (FAQs)
Q1. Why did Mendel choose the garden pea for his experiments? Because it had easily distinguishable contrasting traits, could be both self- and cross-pollinated with ease, had a short life cycle, and produced a large number of offspring — giving statistically reliable results.
Q2. What is the difference between genotype and phenotype? Genotype is an organism’s actual genetic makeup (e.g., Tt), while phenotype is the physically observable trait that results from that genotype (e.g., tall).
Q3. What is the difference between incomplete dominance and co-dominance? In incomplete dominance, the heterozygote shows an intermediate phenotype (e.g., pink flowers from red and white parents). In co-dominance, the heterozygote shows both parental phenotypes fully and simultaneously (e.g., AB blood group).
Q4. Why don’t linked genes follow the Law of Independent Assortment? Because they are located close together on the same chromosome and tend to be inherited together, rather than assorting independently, unless separated by crossing over during meiosis.
Q5. Is Down’s syndrome inherited from a parent? Not in the classic Mendelian sense — it results from non-disjunction (an error in chromosome separation) during gamete formation, producing a gamete with an extra copy of chromosome 21, rather than from a specific “disease allele” passed down through generations.
These notes are designed for Class 12 Biology board exam revision (NCERT-based curriculum) and cover the complete chapter on Principles of Inheritance and Variation.
Other topics you might be interested in:
Human Reproduction Class 12 Notes Biology
Sexual Reproduction in Flowering Plants: Class 12 Biology Notes